


Wargaming Oil Price Risk in the U.S.–Israel–Iran Conflict
An agent-based simulation of partial closure scenarios in the Strait of Hormuz

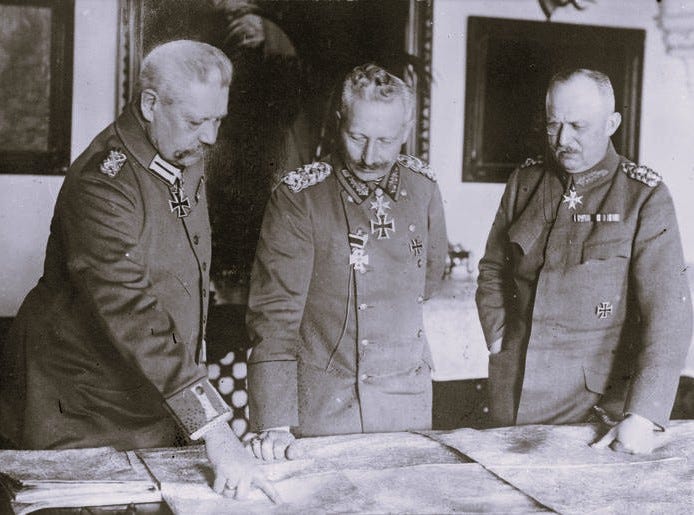
Wargaming is a military planning tool, and has roots in the tabletop Kriegsspiel, German for “war game”, from the 19th-century Prussian military, where officers began simulating battles on maps. These early simulations were training devices to expose officers to the friction of decision-making before facing real combat.
By the late 1800s, Prussian wargames had evolved into structured exercises, complete with umpires, scenario injects, and adjudication rules. The role of the umpire was to inject realism by interpreting ambiguous situations, deciding whether a unit would break or hold, whether a cavalry charge would succeed or fail. The intent was to force players to think under uncertainty.
Over time, wargaming spread across European militaries, and eventually to the U.S. Naval War College and other strategic institutions such as NATO. The purpose in general is to rehearse decision-making, anticipate opponent behavior, and explore outcomes, but not to predict the future.
Wargaming is more about exposing the logic of escalation, showing how a chain of plausible decisions can lead to strategic dilemmas. This also makes it valuable in energy and geopolitical contexts. In this post, I build a wargaming framework based on certain available public domain literature, and apply it to the current ongoing Israel-Iran conflict and the involvement of the U.S. as a global superpower. In particular, I use the framework to assess the impact of a potential partial closure of the strategic Strait of Hormuz on the global oil prices. This is something that I briefly touched on in my earlier post about oil trading, but now that this situation is turning into a full-fledged war, I decided to spend more time on it.
Today, digital tools allow us to simulate wargames faster and more scalable, and I created a simple simulation tool (available on Google Colab) based on the framework I introduce in the next sections. This is a simple code that the readers should be able to follow and make changes to the scenarios to create oil price outcomes.
Deriving the Framework
The starting point for my framework comes from a detailed wargame report by Center for Strategic and International Studies (CSIS) titled The First Battle of the Next War: Wargaming a Chinese Invasion of Taiwan. This comprehensive document is more or less a blueprint for how to build a structured, transparent wargame around a high-stakes geopolitical scenario.
What made the CSIS approach useful was its modular clarity and mixture of qualitative and quantitative analysis. The simulation ran across dozens of iterations with defined player roles (China, U.S., Taiwan, Japan), a turn-based structure, clear adjudication rules, and outcome metrics.
The most important element that I extracted from the CSIS wargame is its design logic. This became what I refer to as the CSIS-driven framework in this post, and serves as a general-purpose method that breaks a scenario into reusable structural components:
Turn structure: Decision, resolution, outcome, repeat.
Player roles: Each side has distinct capabilities and escalation thresholds.
Adjudication logic: Events are interpreted probabilistically or through predefined thresholds.
Outcome tracking: Metrics are tracked per turn to show escalation, attrition, or recovery.
Feedback loops: Player decisions modify the operational or political environment in future turns.
This allows the same approach to be used in a different strategic theater, in our case, the Persian Gulf, and the Strait of Hormuz. This is a policy tool, flexible enough to simulate high-impact disruptions like a mining campaign in the Strait of Hormuz, and compare outcomes across multiple simulations in an energy choke point and oil market implications.
Below are the main components of the CSIS Taiwan report that I generalized for this post’s framework:
1. Asymmetric Pressure + Timing Tradeoffs
In the CSIS Taiwan game, China needed to achieve strategic objectives quickly before U.S. and allied forces could fully mobilize. The U.S., on the other hand, had to delay and disrupt. That timing asymmetry is not unique to East Asia, so I used that same asymmetry into our Hormuz scenario. In this case, the Red team (Iran and proxies) seeks early disruption (sea mines, Seraj-class attack boats, drone strikes, etc.) before Blue (U.S. naval or multinational presence) can stabilize flow.
2. ISR and Visibility as Fragile Assets
Intelligence, surveillance, and reconnaissance (ISR) mattered enormously in the Taiwan scenario. Poor ISR meant ineffective U.S. strikes, late detection of Chinese moves, or misallocated defense. I generalized ISR into a sliding variable (between 0 and 1) that affects what actions are possible, what retaliation is credible, and whether escalation is proportional.
3. Turn-Based Non-Symmetry
Although both sides had turns, their moves weren’t mirrored. One side deployed air assets, the other laid mines. One side launched amphibious landings, the other set up blockade enforcement. This non-parallel turn logic where each team’s decision space is qualitatively different is a powerful modeling tool. It encourages realism over game balance and I brought this into the Hormuz simulation where Red doesn’t mirror Blue and instead behaves differently because its tools are different (less sophisticated).
4. Operational Outcomes Driving Political Tension
In CSIS’s Taiwan game, damage to ships, loss of airfields, or delay in amphibious landings became political inflection points. I translated this insight to oil price variations. In the Persian Gulf environment, tanker throughput and oil prices serve the same function and are proxies for international political stress.
To localize the wargame to the Persian Gulf, I used another CSIS briefing by Anthony Cordesman titled Iran, the Gulf, and the Strait of Hormuz, from 2012. Though over a decade old, the document remains one of the most detailed, available to public, threat assessments of how Iran could disrupt maritime oil flow through asymmetric means. It provided the raw material needed to shape a realistic Strait of Hormuz closure scenario.
I use this 2012 CSIS document to identify the operational levers available to Iran (Red team) and the structural vulnerabilities in the Persian Gulf oil flow architecture that a Blue force would need to protect. Cordesman’s document laid these out perfectly.
From the report, I extracted these key elements:
Mine warfare: Iran’s historical (Iran-Iraq War in the 1980s) and doctrinal emphasis on using naval mines in chokepoints. Mines are cheap, persistent, and hard to detect that makes them a perfect asymmetric tool to disrupt tanker traffic.
Drone and fast-boat swarming: The report includes evolving capabilities in UAVs and fast attack craft, which could be used to harass or strike tankers and escort ships, or even other U.S. facilities or assets. These less sophisticated methods of attack don’t need to defeat the U.S. Navy and as long as they delay or destabilize shipping lanes, they can influence oil price spikes.
GPS spoofing and electronic warfare: CSIS highlighted Iran’s focus on electronic countermeasures, particularly GPS disruption and spoofing. In a wargame setting, this means degraded ISR or navigation accuracy, raising risks without requiring kinetic confrontation.
Proxy escalation: While not the report’s main focus, it acknowledged the regional network of non-state actors that could escalate horizontally. After the recent events in Syria and Lebanon, the role of proxies supporting Iran is reduced, but not eliminated and forces such as the Houthis in Yemen or Iraqi militia groups can play a role. I introduce this as a conditional variable in the model that if certain triggers are hit, proxies could activate.
Market sensitivity to shock: The report correctly pointed out that even short-term threats to the Strait can cause outsized oil price spikes. It’s not throughput loss alone, as I explained in my earlier post, and the perceived risk of future supply can have more drastic price implications.
All of these features are translated into the simulation tool, as quantified capabilities and thresholds.

Main Elements of the Strait of Hormuz Crisis Wargaming Framework
The elements extracted from the two CSIS reports are used to build a modular simulation architecture designed to reflect escalation risk, oil market disruption, and asymmetric conflict dynamics specific to the Strait of Hormuz.
Here are the core components of the framework:
1. Asymmetric Red-Blue Roles
Red (Iran + proxy actors): Operates under resource constraints and inferior technology (access to mines, drones, GPS jamming), and possibly proxy escalation.
Blue (U.S. or multilateral naval presence): Focuses on maintaining tanker flow, neutralizing threats, and avoiding escalation (involving other regional facilities, or even China and Russia) while preserving freedom of navigation.
2. Turn-Based Logic with Escalation Triggers
Each game progresses in 10 turns, which can represent hours, days or weeks depending on tempo. Every turn includes:
Red decision
Blue response
Adjudication of incidents
Market ($) and oil throughput (%) updates
Internal state changes (retaliation mode, ISR degradation, recovery counters)
Escalation is not hard-coded. It emerges from Red’s actions and Blue’s thresholds (set at an arbitrary level, but subject to change) for retaliation or ISR loss.
3. Key System Variables
The simulation tracks several operational and market-relevant variables:
Tanker throughput (% of normal oil flow): Measures flow of oil through Hormuz
Oil price ($/barrel): Reacts to incidents and recovers over calm periods
Incident count per turn: Proxy (not to be confused with military proxy) for escalation pressure
ISR quality: Determines Blue's effectiveness in detecting and responding
Mines active: A persistent hazard until cleared
4. Adjudication Mechanisms
Instead of fixed outcomes, the game uses probability thresholds for events like:
A mine hitting a tanker (based on number of active minefields)
A drone strike successfully damaging throughput
Blue clearing a mine based on Mine Countermeasure (MCM) effectiveness
This adds realism because high capability doesn't necessarily guarantee impact or control, and risk is presented and must be managed probabilistically.
5. Recovery and De-escalation Dynamics
Two layers of recovery were added to mirror strategic patience:
Throughput recovery: If two peaceful turns pass, Blue gradually restores oil flow
Market cooling: If incidents stop and throughput improves, oil price begins to correct downward
These rules incentivize restraint and provide a path of de-escalation which is something missing in many purely kinetic games.
6. Outcome Metrics
The framework produces time-series data:
Price trajectory (10 steps by default, but user can change)
Throughput trend
Number and timing of incident(s)
These allow for comparative runs, Monte Carlo batch analysis, or policy interventions.
Simulation: Agent-Based Modeling
To translate the wargame into a working simulation, I use a 2025 RAND paper titled “Artificial Intelligence for Wargaming and Modeling” by Paul K. Davis and Paul Bracken. This paper doesn’t prescribe a single architecture but it lays out the building blocks for using agent-based systems to explore strategic competition under uncertainty.

The authors emphasize that wargames and models should simulate reasoning agents, not just rule-based automata. These agents should have their own objectives, thresholds for risk, and evolving postures. I use the models, insights, functions, decision aids, and proposed cognitive agent relationships presented by them and implemented them to create two “agent” functions, one for Red, one for Blue. These aren’t AI in the technical sense, but they behave like reasoning actors under constraints. For example, Red decides to escalate (mines, drones, jamming) based on throughput success and oil price pressure. In the model, I use drones as a proxy for missiles, fast attack boats, drones, etc. for simplicity. Blue responds based on ISR clarity and perceived threat, including triggering retaliation mode if tanker throughput drops below a certain level. These agents don’t plan five moves ahead. But they behave consistently under stress, with rules that simulate strategic intent.
I also apply a probabilistic modeling, to replicate real-world outcomes. For example, laying mines does not guarantee tanker hits, drone strikes and boat attacks do not land impact, and Blue can deploy mine countermeasures, but success is probabilistic These soft rules allow scenario variation without hardcoding everything. One simulation might feature a dramatic early escalation (turns 1, 2). Another might play out quietly until late in the game (turns 8, 9).
The paper also encourages treating the scenario as states, where the environment evolves with player choices. I applied that idea using a central “state” dictionary in the code. Each turn updates ISR, oil price, mine count, retaliation mode, and other live variables. These feed into the next turn’s decision logic. This architecture is lightweight but powerful. It keeps the model interpretable while still enabling path-dependent complexity. In a more advanced Machine Learning approach these can be expanded into a broader vector of tens or hundreds of features.
Example Simulation:
To demonstrate how the wargame plays out, I ran a single 10-turn simulation which could be replicated with a fixed random seed (random.seed(99)). The results reveal how incremental disruption, without full-scale retaliation, can still cause significant market and operational strain. Image below shows that oil ends at $130 with only 5 incidents during the simulation time frame of 10 turns.
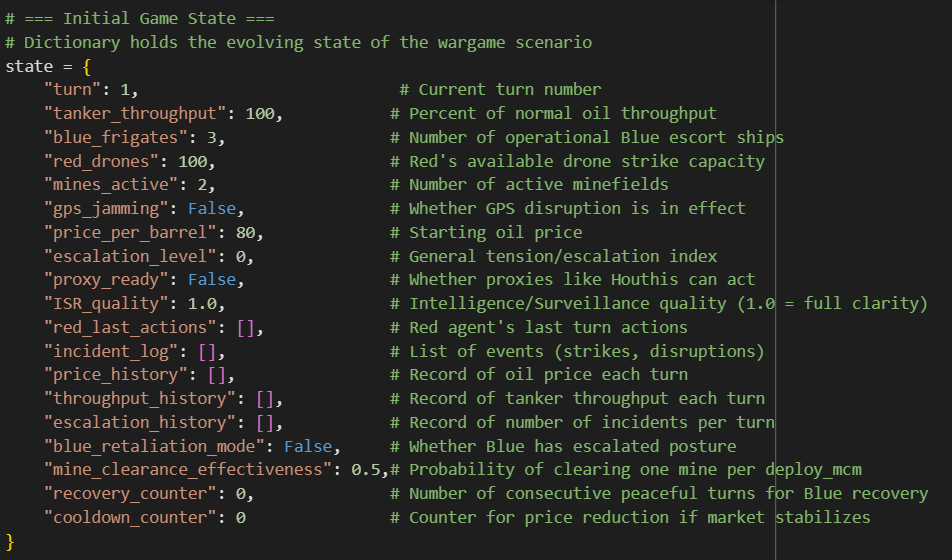
state dictionary. It tracks key dynamics like oil flow (tanker_throughput), market reaction (price_per_barrel), active threats (mines_active, gps_jamming), and decision logic (blue_retaliation_mode, ISR_quality). Each turn updates this object, letting Red and Blue adapt their actions as the scenario unfolds. This structure keeps the model transparent, tunable, and easy to expand.The Red team (Iran) began the simulation by immediately escalating, launching drone strikes and laying mines in the Strait of Hormuz. In the first two turns, both strikes succeeded in hitting tankers, triggering sharp oil price increases from $95 to $110 and cutting throughput from 100% to 80%. Initial oil price in turn zero is set at $80.
Despite this, Blue chose not to escalate into full retaliation (because this threshold is set at below 70% oil flow throughput in the model). Instead, it focused on mine-clearing operations (deploy_mcm) and a limited airstrike on drone carriers in Turn 2. Blue’s ISR remained intact, but the Red team shifted tactics by Turn 3, dropping kinetic attacks in favor of sustained GPS jamming and mine deployment.
This move led to a new dynamic as a lull in direct incidents is observed, but with persistent risk accumulation. With no tankers hit from Turns 3 to 5, the system briefly stabilized. As seen in the below figure of the time-series plots:
Throughput recovered from 80% to 85%
Oil prices dipped from $110 to $105 due to built-in market correction logic

But the situation degraded again in Turn 6, when a mine hit a tanker, restarting the escalation loop. Red continued to build up mine density, eventually deploying six active minefields by Turn 10. Incidents reappeared in Turns 6, 7, and 10, each time resetting Blue’s recovery counters and driving up oil prices.
Meanwhile, Blue remained hesitant to commit to full escalation until Turn 8, when tanker throughput dropped to 65% (as mentioned earlier this is the threshold set for triggering retaliation_mode). From that point on, Blue consistently struck drone carriers (or speed attack boats) while still focusing on mines. However, with persistent GPS jamming and increasing minefields, it struggled to regain control.
Download the Simulation Notebook:
You can run it in Google Colab by uploading the file, or use it in Jupyter locally.
Obviously this model is not comprehensive and the readers can make several improvements. One area where the current simulation could be improved is in modeling resource attrition, especially for Red’s drone (or attack boats and missiles) stockpile. Right now, the code initializes Red (Iran) with a fixed number of drones (red_drones = 100), and reduces that count only when Blue launches a successful strike on a drone carrier. However, drone launches themselves don’t consume resources, which means Red can continue striking in future turns as long as it avoids being hit, even if, in a real scenario, each drone sortie would deplete inventory. This simplification keeps the logic clean, but it understates the long-term impact of sustained operations. For users who want to experiment further, it's easy to enhance this logic. Simply subtract a fixed number of drones, like 10, or 15, for each Red drone strike, and prevent further strikes once the stock reaches zero. Doing so would more accurately model exhaustion, deterrence, and the value of preserving strike capacity in a drawn-out crisis. I also did not trigger the Iran proxy forces (Houthis disturbance in Red Sea area) activating in most of my runs to keep the simulation geographically limited to the Persian Gulf region, it’s defined as "proxy_ready": False, but it can be changed by the user to assess the potential impact.
Monte Carlo for Strategic Uncertainty
Following RAND papers’s emphasis on using modeling for policy robustness (not forecasting), I also embedded a Monte Carlo mode into the game. This lets the user run 100+ simulations of the same scenario and observe how often key outcomes emerge This allows the model to act more like a decision support tool, not to guess what will happen, but to map what could happen, and how likely.
To understand broader patterns beyond a single simulation, I ran 100 Monte Carlo iterations of our Strait of Hormuz wargame. Each run introduced variation in incident outcomes, mine strikes, and Blue’s success in response. The plots below show the average outcome per turn along with a 10–90% confidence band to capture scenario volatility.

Oil Price trajectory (left plot), shows that oil prices climb steadily from around $90 to $125 across 10 turns. The confidence interval shades widens significantly, especially mid-game, indicating that some runs saw rapid market panic (spiking above $130) while others experienced partial corrections. Even with relatively few incidents, the perception of risk is enough to maintain upward pressure, confirming that oil markets are highly reactive to disruption in chokepoints like Hormuz.
Tanker Throughput (center plot) shows decline consistently from ~95% to ~65%, with a spread of outcomes ranging from full recovery in Turn 2, to near-complete closure (~55% disruption). The steepest drop occurs in the early-mid turns, suggesting that once Red (Iran) mines accumulate or drone strikes land, it becomes difficult for Blue (U.S.) to regain control, especially if mine clearance fails or retaliation is delayed. This shows how early action (or inaction) compounds over time.
Incident Frequency (right plot) shows that the average incident count stays below 1 per turn, with a narrow variance band. From an energy security risk point of view, I guess this is the most important observation in this simulation. This confirms that Red (Iran) doesn’t need to strike constantly to be effective. A few well-timed actions, especially early on, can push Blue (U.S.) into a reactive posture and allow the situation to degrade even during low kinetic intensity.
If you also like to review the version of the code with the Monte Carlo loop, reply in the comments section with your email, or message me on the platform and I will share the link.
Sources:
Cancian, M. F., Cancian, M., & Heginbotham, E. (2023). The First Battle of the Next War. Center for Strategic & International Studies. Recuperado el, 10. https://www.naval.com.br/blog/wp-content/uploads/2023/01/Wargaming-a-chinese-invasion-of-Taiwan.pdf
Davis, P. K., & Bracken, P. (2025). Artificial intelligence for wargaming and modeling. The Journal of Defense Modeling and Simulation, 22(1), 25-40. https://www.rand.org/pubs/external_publications/EP68860.html
Cordesman, A. H. (2012). Iran and the Threat to" close" the Gulf. Center for Strategic and International Studies. https://www.csis.org/analysis/iran-and-threat-close-gulf